
When we built the One Stop Racing members’ app, one of the most important features we introduced was the Score column — a composite figure that draws together every element of the OSR rating model into a single number for each runner. Today we want to share exactly what that column has been doing for Diamond Members since the beginning of August.
What Is the Score Column?
The OSR racecard already shows you individual rating pillars — OSR (our overall rating), LR (last run performance), HS (horse speed), and SR (trainer/jockey strike rate contribution). The Score column synthesises all of those into one composite figure, unique to each runner on each day. The higher the Score, the stronger the overall profile. Runners are ranked from top to bottom by Score, so at a glance you can see our model’s strongest selection in any race.
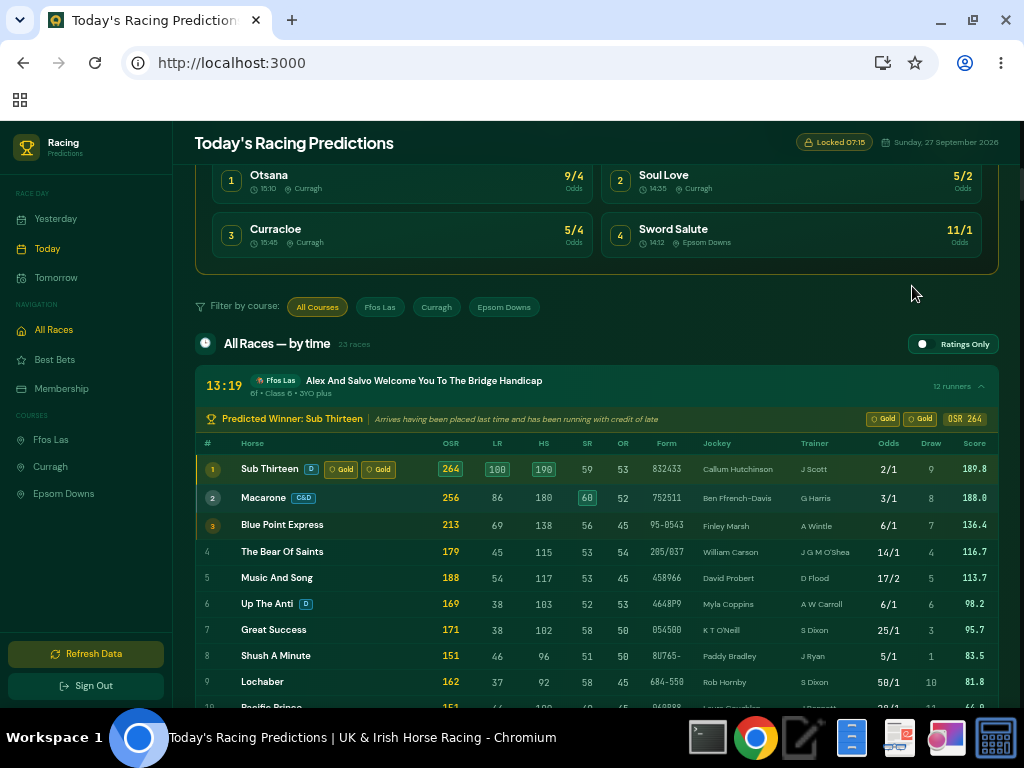
The full OSR racecard — the Score column (far right) ranks every runner by their composite figure. Sub Thirteen tops the field here on 189.8.
Diamond Members also have access to the Ratings Only toggle — a stripped-down view that removes all the additional clutter and shows the core rating columns sorted cleanly for rapid assessment across all races.
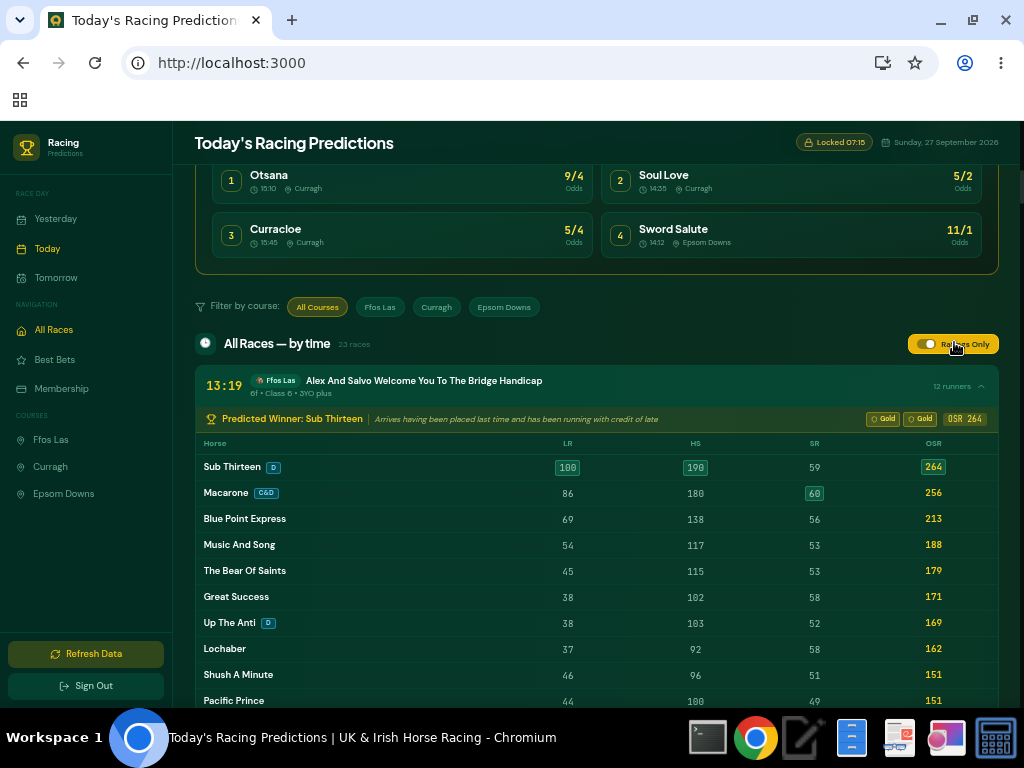
The Ratings Only toggle strips the racecard back to its essentials — ideal for quickly working through a full card.
The Numbers: 3 August – 27 September 2026
We have analysed every race in the OSR database across 56 days of racing — a total of 1,974 races — splitting results between handicaps and non-handicaps. Here is how the top four in the Score column have performed.
Non-Handicap Races (700 races)
| Score Rank | Races | Winners | Win Strike Rate | Place Rate (top 3) |
|---|---|---|---|---|
| #1 — Top Score | 700 | 235 | 33.6% | 63.4% |
| #2 | 700 | 145 | 20.7% | 56.4% |
| #3 | 697 | 96 | 13.8% | 45.9% |
| #4 | 687 | 55 | 8.0% | 37.1% |
In non-handicap races, the top Score runner has won 1 in every 3 races — a 33.6% strike rate that speaks for itself. Nearly two thirds of top-scored runners in non-handicaps finish in the first three.
Handicap Races (1,274 races)
| Score Rank | Races | Winners | Win Strike Rate | Place Rate (top 3) |
|---|---|---|---|---|
| #1 — Top Score | 1,274 | 248 | 19.5% | 47.8% |
| #2 | 1,274 | 205 | 16.1% | 43.7% |
| #3 | 1,271 | 169 | 13.3% | 40.9% |
| #4 | 1,258 | 143 | 11.4% | 35.7% |
Handicaps are — as you would expect — a tougher nut to crack. The weights are designed to equalise every runner’s chances. Against that, a 19.5% win strike rate and a 47.8% place rate for the top-scored runner are results any serious punter would welcome. Nearly half of top-scored handicappers finish in the first three.
Winning Prices of the Top 4 Scorers
To give a full picture we have also tracked the starting prices of every winner that came from the top four in the Score column. These cover 9 August to 26 September (the first week of August had no stored prices). Late non-runners were removed before ranking.
Non-Handicap Winners (622 races)
Top scorer — 228 winners:
1/33 x 1, 1/25 x 1, 1/18 x 1, 1/10 x 1, 1/9 x 1, 1/8 x 1, 1/7 x 1, 2/13 x 1, 1/6 x 3, 2/11 x 2, 1/5 x 2, 2/9 x 2, 1/4 x 3, 30/100 x 2, 1/3 x 5, 4/11 x 5, 2/5 x 9, 4/9 x 6, 1/2 x 3, 8/15 x 5, 4/7 x 4, 8/13 x 7, 4/6 x 9, 8/11 x 5, 4/5 x 11, 5/6 x 5, 10/11 x 6, Evs x 7, 11/10 x 7, 6/5 x 11, 5/4 x 6, 11/8 x 6, 6/4 x 11, 13/8 x 7, 7/4 x 7, 15/8 x 4, 2/1 x 4, 9/4 x 8, 5/2 x 10, 11/4 x 8, 3/1 x 10, 10/3 x 2, 7/2 x 4, 4/1 x 3, 9/2 x 1, 5/1 x 2, 11/2 x 2, 13/2 x 1, 7/1 x 3, 8/1 x 1, 14/1 x 1
2nd top scorer — 137 winners:
1/9 x 1, 2/7 x 1, 30/100 x 2, 2/5 x 2, 4/9 x 4, 1/2 x 4, 8/15 x 1, 4/7 x 2, 8/13 x 3, 4/6 x 3, 8/11 x 1, 5/6 x 1, 10/11 x 4, Evs x 5, 11/10 x 1, 6/5 x 3, 5/4 x 3, 11/8 x 4, 6/4 x 4, 13/8 x 6, 7/4 x 5, 15/8 x 5, 2/1 x 7, 85/40 x 2, 9/4 x 10, 5/2 x 5, 11/4 x 7, 3/1 x 3, 10/3 x 5, 7/2 x 3, 4/1 x 7, 9/2 x 4, 5/1 x 3, 11/2 x 3, 13/2 x 2, 7/1 x 1, 15/2 x 1, 8/1 x 1, 17/2 x 2, 9/1 x 1, 10/1 x 1, 12/1 x 2, 18/1 x 1, 22/1 x 1
3rd top scorer — 70 winners:
5/6 x 1, Evs x 3, 11/10 x 1, 6/5 x 1, 6/4 x 1, 13/8 x 1, 7/4 x 3, 15/8 x 2, 2/1 x 3, 9/4 x 1, 5/2 x 2, 11/4 x 2, 3/1 x 4, 10/3 x 9, 7/2 x 2, 4/1 x 6, 9/2 x 9, 11/2 x 4, 6/1 x 2, 13/2 x 2, 7/1 x 1, 15/2 x 1, 17/2 x 1, 9/1 x 3, 10/1 x 1, 11/1 x 1, 12/1 x 1, 14/1 x 1, 20/1 x 1
4th top scorer — 49 winners:
30/100 x 1, 2/5 x 1, 8/11 x 1, 5/6 x 1, 6/5 x 1, 11/8 x 1, 6/4 x 2, 13/8 x 1, 7/4 x 2, 2/1 x 4, 9/4 x 2, 5/2 x 1, 3/1 x 5, 10/3 x 2, 7/2 x 2, 4/1 x 2, 9/2 x 4, 5/1 x 1, 11/2 x 3, 6/1 x 1, 13/2 x 1, 7/1 x 1, 15/2 x 1, 17/2 x 1, 10/1 x 1, 11/1 x 1, 14/1 x 2, 20/1 x 1, 25/1 x 1, 66/1 x 1
The top four scorers between them won 484 of the 622 non-handicap races — 77.8% of the total.
Handicap Winners (1,146 races)
Top scorer — 233 winners:
1/16 x 1, 1/6 x 1, 1/4 x 1, 2/7 x 1, 4/11 x 1, 2/5 x 1, 4/9 x 3, 1/2 x 2, 8/15 x 4, 4/7 x 2, 8/13 x 2, 8/11 x 1, 4/5 x 3, 5/6 x 1, 10/11 x 4, Evs x 5, 11/10 x 4, 6/5 x 2, 5/4 x 8, 11/8 x 6, 6/4 x 10, 13/8 x 7, 7/4 x 10, 15/8 x 8, 2/1 x 14, 9/4 x 13, 5/2 x 9, 11/4 x 12, 3/1 x 13, 10/3 x 13, 7/2 x 15, 4/1 x 11, 9/2 x 8, 5/1 x 10, 11/2 x 5, 6/1 x 6, 13/2 x 1, 7/1 x 1, 15/2 x 1, 8/1 x 2, 17/2 x 1, 9/1 x 1, 10/1 x 4, 11/1 x 1, 12/1 x 1, 14/1 x 2, 25/1 x 1
2nd top scorer — 188 winners:
2/5 x 1, 4/7 x 1, 4/6 x 1, 8/11 x 3, 5/6 x 1, 10/11 x 1, Evs x 3, 11/10 x 1, 6/5 x 3, 5/4 x 8, 11/8 x 7, 6/4 x 6, 13/8 x 5, 7/4 x 2, 15/8 x 4, 2/1 x 7, 9/4 x 7, 5/2 x 11, 11/4 x 9, 3/1 x 17, 10/3 x 8, 7/2 x 11, 4/1 x 12, 9/2 x 10, 5/1 x 4, 11/2 x 6, 6/1 x 6, 13/2 x 4, 7/1 x 8, 15/2 x 2, 8/1 x 2, 17/2 x 4, 9/1 x 3, 10/1 x 2, 11/1 x 3, 12/1 x 3, 14/1 x 1, 33/1 x 1
3rd top scorer — 145 winners:
1/2 x 1, 4/6 x 1, 10/11 x 1, 6/5 x 1, 5/4 x 1, 11/8 x 4, 6/4 x 4, 13/8 x 2, 7/4 x 2, 15/8 x 3, 2/1 x 7, 9/4 x 7, 5/2 x 9, 11/4 x 5, 3/1 x 9, 10/3 x 9, 7/2 x 11, 4/1 x 8, 9/2 x 11, 5/1 x 16, 11/2 x 4, 6/1 x 8, 13/2 x 3, 7/1 x 2, 15/2 x 1, 8/1 x 3, 17/2 x 1, 9/1 x 3, 10/1 x 4, 12/1 x 2, 14/1 x 1, 16/1 x 1
4th top scorer — 138 winners:
11/10 x 2, 6/4 x 1, 13/8 x 1, 7/4 x 1, 15/8 x 4, 2/1 x 3, 85/40 x 1, 9/4 x 3, 5/2 x 3, 11/4 x 3, 3/1 x 10, 10/3 x 7, 7/2 x 5, 4/1 x 11, 9/2 x 15, 5/1 x 6, 11/2 x 7, 6/1 x 4, 13/2 x 5, 7/1 x 4, 15/2 x 6, 8/1 x 4, 17/2 x 3, 9/1 x 5, 10/1 x 9, 11/1 x 5, 12/1 x 1, 14/1 x 1, 16/1 x 5, 18/1 x 1, 22/1 x 1, 80/1 x 1
The top four scorers between them won 704 of the 1,146 handicap races — 61.4% of the total.
Prices shown are the final market prices recorded by the app on each race day, effectively starting price. 3–8 August excluded (no price data stored).
What Does This Mean in Practice?
These figures are drawn from real OSR data across nearly two months of British and Irish racing. The Score column is not a magic wand — horse racing never is — but it provides a consistent, data-driven starting point for every race assessment. Whether you’re hunting a winner in a conditions race or filtering a big handicap field, knowing which runner the model rates highest by composite score gives you a clear edge before you even look at the form book.
Used alongside the other OSR rating columns and our daily tips, the Score column becomes part of a coherent system rather than a standalone selection tool. That is exactly how Diamond Members have been using it — and the results since August show it is earning its place.
🍰 Unlock the Score Column with Diamond Membership
Diamond Membership gives you full access to the OSR racecard including the Score column, Ratings Only toggle, daily tips (Nap, Little Earner, Feature Race), Possible Bets & Lays, and our full systems suite — for every race, every day.
Join Diamond MembershipStrike rate analysis based on OSR composite Score column data, 3 August – 27 September 2026. 1,974 races across 56 days of UK and Irish racing. Past performance does not guarantee future results.